Understanding Purity Percentages on COAs 11 Powerful Truth Every Research Must Know Before Buying Peptides

When researchers first receive a Certificate of Analysis (COA), the first thing most people notice is the bold purity percentage printed near the top of the document.
99% purity. 98% purity. 95% purity.
For many buyers, that single number determines whether a peptide is considered high quality or not.
After reviewing thousands of peptide COAs since 2003, I can confidently tell you this is one of the biggest mistakes researchers make.
The truth is that Understanding Purity Percentages on COAs requires much more than reading a single percentage. A peptide with 95% purity may outperform another advertised as 99%, depending on what makes up the remaining percentage, how the peptide was tested, how it was manufactured, and how it has been stored.
This misunderstanding has caused researchers to reject perfectly suitable peptide batches, waste research budgets, and even compromise valuable experiments.
In this guide, I’ll explain exactly how experienced peptide suppliers evaluate COAs, reveal common marketing tricks, and teach you how to compare suppliers using scientific evidence instead of flashy purity claims.
Table Of Contents
1. Why most researchers misunderstand purity percentages.
2. What a purity percentage actually means.
3. The four biggest misconceptions are using your examples.
4. Why the remaining 1–5% matters more than the purity number.
5. How experienced suppliers audit a COA (your step-by-step process).
6. Three real case studies demonstrate why purity alone can be misleading.
7. Common marketing tricks suppliers use.
8. How to compare two COAs like an experienced buyer.
9. The lesson learned after reviewing thousands of COAs since 2003 (the morphology and stability insight is unique).
10. A practical COA checklist readers can save.
11. FAQ section targeting common search queries.
12. Strong conclusion and procurement checklist.
What Does Understanding Purity Percentages on COAs Really Mean?
https://pubmed.ncbi.nlm.nih.gov/
A Certificate of Analysis (COA) is a laboratory document that confirms the quality and testing results of a peptide batch.
Although researchers often focus exclusively on purity, a professional COA contains significantly more information, including:
• Identity confirmation
• Molecular weight verification
• HPLC chromatograms
• LC-MS results
• Appearance
• Batch number
• Manufacturing date
• Testing date
• Storage recommendations
• Water content
• Residual solvents
• Heavy metals
• Endotoxin testing (when applicable)
The purity percentage is simply one measurement within a much larger quality profile.
Think of a COA like a medical examination.
If a doctor only checked your temperature and ignored your blood pressure, heart rhythm, blood work, and imaging results, you wouldn’t call it a complete health assessment.
The same principle applies to peptide quality.
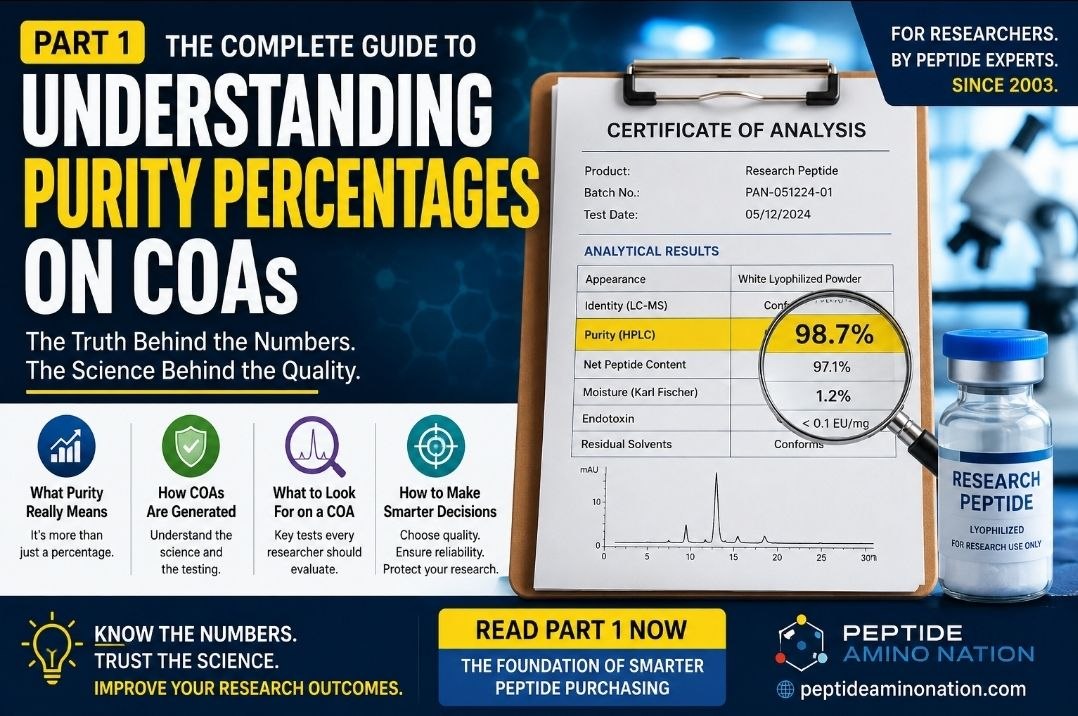
Why Purity Percentage Alone Doesn’t Tell the Whole Story
One of the biggest misconceptions in peptide research is believing that higher purity automatically means better quality.
It doesn’t.
Purity only tells you how much of the analyzed sample matches the intended peptide according to a specific analytical method.
It does not automatically tell you:
• Whether the peptide identity is correct
• Whether harmful contaminants exist
• Whether bacterial endotoxins are present
• Whether moisture has degraded the peptide
• Whether the peptide remains stable during storage
• Whether the batch matches the COA provided
• Whether the manufacturing process was properly controlled
This is why experienced laboratories never approve peptides based solely on purity percentages.
Instead, they evaluate the complete analytical profile.
The Four Biggest Misconceptions About Understanding Purity Percentages on COAs
H2: 1. “100% Purity Should Be Standard”
This is probably the most common misunderstanding.
Many researchers assume anything below 100% means poor manufacturing.
Reality is very different.
Producing absolute chemical purity is extraordinarily difficult.
Every additional fraction of a percent requires significantly more purification steps, additional testing, greater manufacturing costs, and diminishing returns.
For research peptides, purity levels around 98–99% are already considered excellent.
Attempting to achieve theoretical 100% purity often provides little additional scientific benefit while dramatically increasing costs.
H2: 2. “The Remaining 1% Must Be Dangerous”
This assumption creates unnecessary concern.
Researchers frequently ask:
“What’s inside the remaining 1%?”
In many professionally manufactured peptides, that remaining percentage may simply consist of:
• Moisture absorbed from the atmosphere
• Residual purification salts
• Safe counterions
• Trace synthesis by-products
• Very small peptide deletion sequences
Those components are not automatically harmful.
Understanding what comprises that remaining percentage is far more important than obsessing over the purity number itself.
H2: 3. Purity Is Not the Same as Potency
Another major misunderstanding involves confusing purity with potency.
These terms describe entirely different concepts.
Purity
Describes how much of the powder consists of the intended peptide.
Potency
Describes how much biologically active peptide is delivered within the final preparation.
For example:
A peptide powder may be 99% pure, but if it contains significant moisture, counterions, or incorrect dosing calculations during reconstitution, the actual delivered concentration may differ considerably.
Experienced researchers always calculate actual peptide concentration—not simply rely on purity percentages.
H2: 4. 99% Isn’t Always Better Than 98%
This surprises many researchers.
Imagine two peptide batches.
Batch A
• 99% purity
• Hidden endotoxin contamination
• High moisture absorption
• Poor lyophilization
• Degraded during storage
Batch B
• 98% purity
• Excellent structural stability
• Low moisture content
• Proper storage
• Freshly manufactured
Which peptide would produce more reliable research?
Most experienced laboratories would choose Batch B.
Quality is determined by the entire manufacturing process—not one isolated percentage.
Why 100% Purity Is Practically Impossible
Every manufacturing process introduces unavoidable variables.
Even after extensive purification, trace amounts of naturally occurring substances remain, including:
• Water molecules
• Counterions
• Residual solvents below accepted safety limits
• Minor synthesis intermediates
• Analytical uncertainty
Completely eliminating every molecule except the target peptide would require laboratory standards that are economically impractical for routine research.
Fortunately, scientific research rarely requires theoretical perfection.
Instead, researchers need reproducible quality, reliable identity confirmation, and transparent analytical data.
Purity vs Identity vs Potency
Understanding these three concepts prevents countless purchasing mistakes.
| Term | What It Means | Why It Matters |
| Purity | Percentage of target peptides | Indicate relative composition |
| Identity | Confirm the molecule is correct | Verify using LC-MS or MS |
| potency | Actual biological activity | Determines experimental performance |
An experienced researcher evaluates all three—not purity alone.
The Real Question Isn’t “How Pure Is It?”
Instead, ask:
How was purity measured?
Which analytical method was used?
Was HPLC properly validated?
Does LC-MS confirm molecular identity?
Does the COA match my batch number?
Has the peptide degraded since testing?
What exactly makes up the remaining percentage?
These questions separate experienced researchers from inexperienced buyers.
How to Audit a Peptide COA Like an Expert
Why Understanding Purity Percentages on COAs Requires a Full Audit
After reviewing thousands of peptide COAs since 2003, I have learned that the fastest way to spot a high-quality supplier is not by looking at the purity percentage first.
Instead, I follow the same sequence every time:
1. Verify the document.
2. Confirm the batch.
3. Confirm the peptide identity.
4. Inspect the HPLC chromatogram.
5. Check water content and counterions.
6. Review residual solvents and safety data.
7.Evaluate biological testing.
8. Assess stability and storage information.
This process takes only a few minutes, but it can prevent costly purchasing mistakes and protect the integrity of your research.
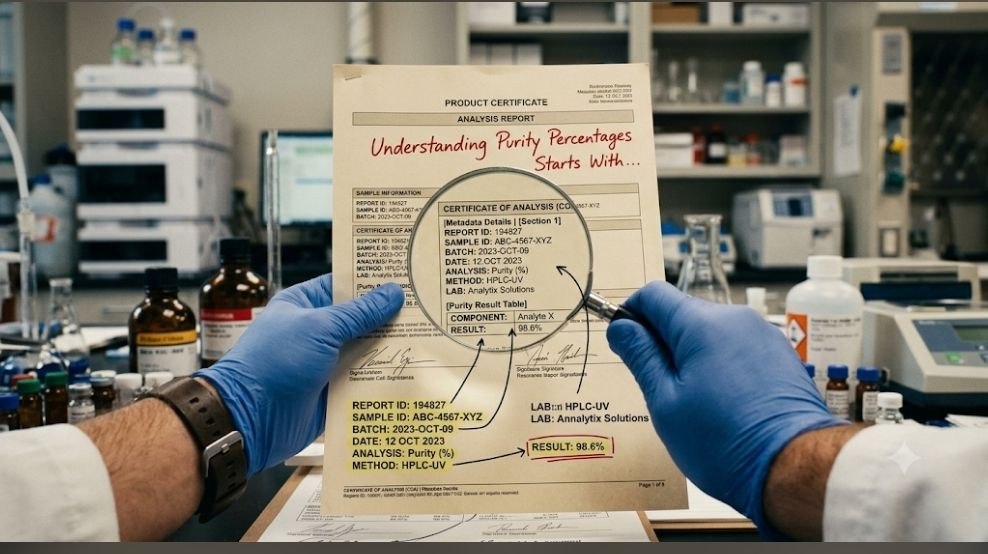
H2: Understanding Purity Percentages on COAs Starts With Metadata
Before examining any analytical data, verify the document itself.
H3: Check These First
| Item | Why It Matters |
| Batch/lot number | Must match the vial or invoice exactly |
| Testing date | Older result may not reflect current quality |
| Re-test or expiry date | Indicate ongoing stability monitoring |
| Laboratory name | Confirm who performs the testing |
| Signature/approval | Shows the COA was formally released |
Expert Tip
If a supplier sends a generic COA without a matching batch number, treat it as marketing material, not a true quality document.
At Peptide Amino Nation, we encourage researchers to request the batch-specific COA for the exact lot being shipped before making a purchase.
H2: Understanding Purity Percentages on COAs and Identity Testing
A peptide can appear highly pure and still be the wrong molecule.
That is why identity testing comes before purity.
H3: LC-MS or Mass Spectrometry
The mass spectrum should show a primary peak matching the peptide’s theoretical molecular weight.
For example:
• Expected mass: 3,245 Da
• Observed mass: ~3,245 Da
A close match confirms that the principal component is the intended peptide.
Why This Matters
If the molecular weight is incorrect, a 99% purity result becomes meaningless because the laboratory may be measuring the purity of the wrong compound.
Understanding Purity Percentages on COAs Through HPLC Chromatograms
Most peptide purity claims are generated using High-Performance Liquid Chromatography (HPLC).
However, experienced auditors examine the graph itself, not just the final percentage.
What a Healthy Chromatogram Looks Like
• One dominant peak.
• Sharp peak shape.
• Symmetrical profile.
• Stable baseline.
• Minimal surrounding peaks.
H3: Red Flags
Peak Tailing
A long tail behind the main peak may indicate unresolved impurities.
Shoulder Peaks
Small bumps attached to the main peak can suggest co-eluting peptide variants.
Noisy Baseline
Excessive baseline noise may reduce confidence in the integration.
Cropped Images
Avoid chromatograms that hide the full run or lack retention times.
H2: What Is the Remaining Percentage?
One of the most important parts of Understanding Purity Percentages on COAs is identifying what is not included in the purity value.
H3: Common Components of the Remaining Percentage
| Component | Typical Concern |
| Water ( moisture) | Usually low concern |
| Counterions ( TFA,acete, HCI) | Important for dosing calculation |
| Truncated peptide sequences | Depends on assay sensitive |
| Residual solvents | Must remain below safety limits |
| Degradation products | May indicate storage issues |
Karl Fischer Water Testing
A peptide listed at 98% purity with 1.5% water content may actually be an excellent batch that simply absorbed a small amount of ambient moisture.
This is why Understanding Purity Percentages on COAs requires examining the entire mass balance.
Residual Solvents and Safety Data
Purity does not automatically equal safety.
What to Look For
• Acetonitrile
• DMF
• DCM
• Methanol
• Ethanol
Professional COAs should report solvent levels using validated methods such as GC or GC-MS.
Preferred Result
• ND (Not Detected), or
• Values well below established specification limits.
Endotoxin Testing — The Hidden Dealbreaker
This is one of the most overlooked sections of peptide quality control.
Why Endotoxins Matter
Endotoxins originate from bacterial cell walls and can:
• Distort cell-culture results.
• Trigger inflammatory responses.
• Reduce experimental reproducibility.
A peptide may be 99% chemically pure while still causing major biological problems if endotoxin levels are elevated.
What to Request
For sensitive biological research, ask for:
• LAL endotoxin testing.
• Results reported in EU/mg.
• Batch-specific documentation.
A Real-World COA Audit Example
Scenario
A researcher compared two suppliers.
Supplier A
• 99.2% purity.
• Generic website COA.
• No batch match.
• No water content.
• No endotoxin data.
Supplier B
• 96.8% purity.
• Batch-specific COA.
• LC-MS confirmation.
• Karl Fischer result provided.
• Residual solvents reported.
• Endotoxin test included.
Outcome
From a scientific standpoint, Supplier B was the stronger choice because the data were transparent, traceable, and complete.
This is a perfect example of why Understanding Purity Percentages on COAs goes far beyond a single headline number.
Quick COA Audit Checklist
Before placing your next peptide order, verify:
Document Integrity
□ Batch number matches.
□ Recent testing date.
□ Laboratory identified.
□ Authorized signature present.
Identity
□ LC-MS/MS or MS confirms molecular weight.
□ Peptide name matches the order.
Purity
□ HPLC method disclosed.
□ Chromatogram included.
□ Peak appears clean and symmetrical.
Mass Balance
□ Water content listed.
□ Counterion information provided.
□ Net Peptide Content available, if applicable.
Safety
□ Residual solvents reported.
□ Heavy metals within limits.
□ Endotoxin testing available for biological research.
Save this checklist and use it every time you compare suppliers.
Real-World Lessons, Industry Secrets, FAQs & Final Buying Guide
Understanding Purity Percentages on COAs: Three Real Case Studies Every Researcher Should Learn From
After supplying research peptides and reviewing thousands of Certificates of Analysis since 2003, one lesson has remained consistent:
Most failed purchasing decisions are not caused by low purity—they are caused by misunderstanding what the purity percentage actually represents.
The following real-world scenarios demonstrate why Understanding Purity Percentages on COAs requires looking beyond a single number.
Case Study 1 – The Researcher Who Rejected a Better Peptide
A university laboratory contacted us looking for a custom research peptide for an in vitro receptor-binding study.
Their procurement policy required a minimum purity of 98%.
One production batch tested at 95% purity, so they rejected it immediately without reviewing the rest of the Certificate of Analysis.
Instead, they sourced another peptide from a different supplier advertising 98% purity.
Unfortunately, they overlooked one critical specification:
Net Peptide Content (NPC).
The replacement batch contained a significantly higher percentage of counterions and moisture.
Although the HPLC purity was higher, the actual amount of active peptide delivered into their experiment was lower.
Because the researchers weighed the powder without accounting for NPC, the final peptide concentration was substantially below their intended target.
The result?
• Poor reproducibility
• Inconsistent biological responses
• Additional purchasing costs
• Lost research time
Key Lesson
A peptide with slightly lower HPLC purity but higher Net Peptide Content may deliver more active peptide than a supposedly “higher-purity” competitor.
This is one of the clearest examples of why Understanding Purity Percentages on COAs involves evaluating the entire analytical profile—not just the headline percentage.
Case Study 2 – The Expensive “99% Pure” Batch That Failed
Another research team insisted on purchasing the highest purity batch available.
They selected a peptide advertised as 99% pure.
The HPLC looked excellent.
However, the COA contained no information regarding:
• Moisture
• Endotoxins
• Residual solvents
• Long-term stability
Within months of storage, the peptide absorbed moisture because it had been poorly lyophilized.
Its physical structure deteriorated rapidly.
Although it left the manufacturer at 99% purity, the peptide degraded significantly before the researchers even began their study.
A competing batch that initially tested at 97% purity maintained its integrity because it had undergone a slower, optimized lyophilization cycle and remained structurally stable throughout storage.
Key Lesson
Purity describes a peptide at one point in time.
Stability determines how well that peptide performs throughout your research.
Case Study 3 – The Hidden Cost of Ignoring Endotoxins
One laboratory experienced repeated failures in cell culture experiments despite purchasing peptides advertised as 99% chemically pure.
After independent testing, the problem became obvious.
The peptide contained measurable endotoxin contamination.
Chemically, the peptide was highly pure.
Biologically, it was unsuitable for sensitive research.
The investigators had focused entirely on purity while overlooking biological quality indicators.
Key Lesson
Chemical purity and biological quality are not the same thing.
A professional researcher should always verify endotoxin testing whenever experimental design requires it.
The Biggest Marketing Tricks Researchers Should Recognize
Unfortunately, not every supplier presents COAs with complete transparency.
Here are several marketing practices experienced buyers should recognize.
Using Representative COAs
Some companies continue displaying an exceptional COA from an older production batch while shipping completely different lots.
Always request the batch-specific COA for the exact material you will receive.
Advertising HPLC Purity Without Explaining the Method
Different analytical methods can produce different purity values.
Professional suppliers disclose:
• HPLC method
• Detection wavelength
• Analytical conditions
• Supporting LC-MS identity confirmation
Transparency always outweighs marketing.
Ignoring Net Peptide Content
Many suppliers highlight HPLC purity while never mentioning Net Peptide Content.
NPC directly influences dosing accuracy and should never be overlooked.
Omitting Stability Information
An impressive purity percentage means very little if the peptide rapidly degrades during storage.
Researchers should always ask about:
• Lyophilization quality
• Recommended storage conditions
• Re-test dates
• Long-term stability
The Most Important Lesson I’ve Learned Since 2003
https://peptideaminonation.com/peptide-dosing-molar-concentration-mg-to-mm/
After reviewing thousands of peptide COAs over more than two decades, one lesson stands above every other.
A peptide’s long-term quality depends more on stability than on chasing the highest possible purity percentage.
Many competitors invest heavily in advertising “99% Purity.”
Far fewer invest the same effort into:
• Optimizing lyophilization cycles
• Reducing moisture absorption
• Maintaining structural integrity
• Preserving stability throughout shipping and storage
Researchers often assume a peptide remains exactly as pure as the day it left the manufacturer’s laboratory.
In reality, storage conditions, packaging quality, moisture exposure, and physical morphology can dramatically influence peptide quality over time.
A stable 97% peptide may deliver far more reproducible research than an unstable 99% peptide that begins degrading shortly after production.
Frequently Asked Questions About Understanding Purity Percentages on COAs
https://peptideaminonation.com/peptide-analytical-vs-preparative-hplc/
Is 95% peptide purity acceptable?
For many research applications, yes.
Suitability depends on your experimental design and the identity of the remaining impurities—not simply the purity percentage.
Is 99% purity always better than 98%?
Not necessarily.
The nature of the remaining percentage matters far more than the percentage itself.
What should I check before purity?
Always verify:
• Batch number
• Identity testing
• Testing date
• HPLC chromatogram
• LC-MS confirmation
before evaluating purity.
Can impurities be harmless?
Absolutely.
Many impurities consist of:
• Water
• Counterions
• Minor peptide variants
• Residual salts
These are often far less concerning than endotoxins or harmful contaminants.
Before Buying Your Next Research Peptide
Use this checklist every time you compare suppliers.
✅ Request the exact batch-specific COA.
✅ Verify the batch number.
✅ Confirm peptide identity using LC-MS.
✅ Review the complete HPLC chromatogram.
✅ Check Net Peptide Content.
✅ Verify Karl Fischer moisture testing.
✅ Review residual solvent results.
✅ Confirm heavy metal testing where appropriate.
✅ Request endotoxin data for sensitive biological research.
✅ Evaluate storage recommendations and stability.
Following this simple process can dramatically improve research reproducibility while helping you avoid costly procurement mistakes.
Read Related Content Below To Expand Your Knowledge About Peptide
Avoiding Measurement Errors During Peptide Reconstitution
Understanding Peptide Hydrophobicity: 9 Powerful Insights That Prevent Costly Research Failures.
The Role of pH in Peptide Solubility:
Understanding Syringe Units for Peptide Research Calculations
How Laboratories Test Peptide Identity
Why Peptide HPLC Purity and Biological Activity Are Different:
Why Different Peptides Have Different Shelf Lives
Conclusion
Understanding Purity Percentages on COAs Requires Looking Beyond the Number
Understanding Purity Percentages on COAs is not about finding the biggest percentage printed on a Certificate of Analysis.
It is about understanding the science behind that percentage.
After reviewing thousands of peptide COAs since 2003, I have found that the most reliable research outcomes come from suppliers who prioritize transparency, complete analytical testing, and batch-specific documentation—not marketing claims.
A trustworthy supplier should be willing to explain how purity was measured, provide supporting analytical data, and answer questions about identity, stability, moisture, residual solvents, and biological quality.
When you begin evaluating COAs this way, you stop buying peptides based on advertising and start selecting them based on scientific evidence.
If you’re looking for professionally manufactured research peptides backed by transparent quality standards, batch-specific Certificates of Analysis, HPLC testing, LC-MS verification, and reliable technical support, visit Peptide Amino Nation at peptideaminonation.com.
Our goal is simple: provide researchers with the information they need to make informed purchasing decisions and support reproducible scientific research through quality, transparency, and consistency.
Final Takeaway
Remember this golden rule:
Never judge a peptide by its purity percentage alone. Judge it by the quality of the science that supports that number.
