Understanding Retention Time in Peptide HPLC: 15 Powerful Facts Every Researcher Must Know

Understanding Retention Time in Peptide HPLC is one of the most valuable skills a peptide researcher can develop. Whether you’re reviewing a Certificate of Analysis (COA), purchasing research peptides, troubleshooting chromatography results, or validating peptide identity, retention time (t<sub>R</sub>) provides critical information—but only when interpreted correctly.
Unfortunately, retention time is also one of the most misunderstood concepts in peptide analysis.
Many researchers assume a peptide should always elute at exactly the same retention time regardless of the laboratory, instrument, or chromatographic conditions. Others mistakenly believe that two peaks sharing the same retention time must represent the same peptide. These misconceptions frequently lead to rejected peptide batches, failed experiments, unnecessary troubleshooting, and wasted research budgets.
The truth is much more complex.
Retention time is not a fixed physical property like molecular weight. Instead, it reflects the interaction between a peptide and its entire chromatographic environment—including the HPLC column, mobile phase composition, gradient profile, temperature, flow rate, instrument dwell volume, and even solvent quality.
Understanding this relationship allows researchers to distinguish genuine peptide problems from analytical artifacts. More importantly, it helps prevent incorrect conclusions that could compromise months of scientific work.
As an experienced peptide supplier, we’ve helped researchers investigate chromatograms, interpret Certificates of Analysis, identify hidden analytical issues, and troubleshoot unexpected retention time shifts. One lesson consistently stands out:
Transparency matters more than simply advertising “98% purity.”
A purity percentage alone never tells the complete story.
A trustworthy analytical package should include:
• Complete HPLC chromatograms
• LC-MS identity confirmation
• Chromatographic conditions
• Peak integration data
• Clear analytical documentation
These details give researchers confidence that they’re purchasing peptides backed by rigorous quality control rather than marketing claims.
In this comprehensive guide, you’ll learn:
• What retention time really means in peptide RP-HPLC
• Why identical peptides can produce different retention times
• How peptide chemistry influences chromatographic behavior
• Common misconceptions researchers make
• How to correctly interpret HPLC chromatograms
• What experienced buyers examine before purchasing peptides
• Real laboratory case studies demonstrating why retention time matters
• Practical strategies for avoiding expensive analytical mistakes
Whether you’re new to peptide research or an experienced laboratory scientist, this guide will help you interpret HPLC data with greater confidence and make more informed purchasing decisions.
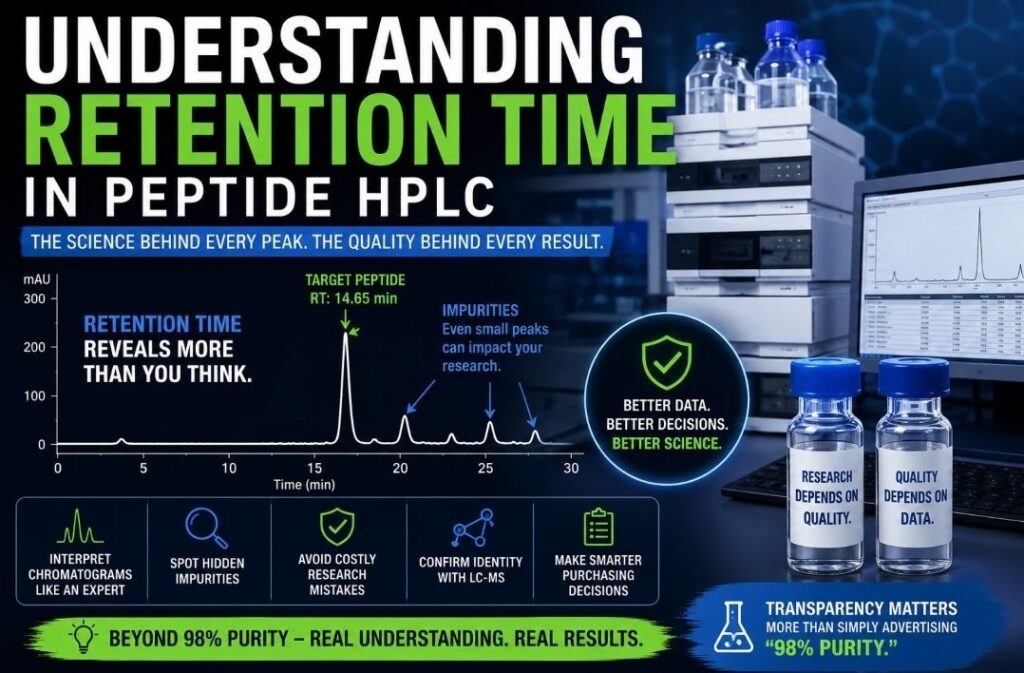
Table of Contents
1. What Is Retention Time in Peptide HPLC?
2. Why Retention Time Matters in Peptide Research
3. The Science Behind Reverse-Phase HPLC Retention
4. Factors That Influence Peptide Retention Time
5. Retention Time Profiles of Different Peptide Classes
6. Six Dangerous Misconceptions About Retention Time
7. How to Read an HPLC Chromatogram Like an Expert
8. Real Laboratory Case Study: The Wandering Doublet
9. Inside Our Peptide Quality Control Workflow
10. Why HPLC and Mass Spectrometry Must Always Work Together
11. How Retention Time Helps Researchers Purchase Better Peptides
12. Common Inter-Laboratory Comparison Mistakes
13. Frequently Asked Questions
14. Final Thoughts
What Is Retention Time in Peptide HPLC?
https://pubmed.ncbi.nlm.nih.gov/
Retention time (commonly abbreviated as t<sub>R</sub>) is the amount of time required for a peptide to travel from the injection port of an HPLC system to the detector, where it appears as a peak on the chromatogram.
Although the definition sounds simple, the science behind retention time is remarkably sophisticated.
In peptide analysis, Reverse-Phase High-Performance Liquid Chromatography (RP-HPLC) is the industry standard because it separates peptides according to their hydrophobicity.
When a peptide sample is injected:
1. The peptide enters the chromatographic column.
2. It repeatedly interacts with the stationary phase.
3. Organic solvent concentration gradually increases during the gradient.
4. Once those interactions become weak enough, the peptide elutes from the column.
5. The detector records the peptide as a chromatographic peak.
The elapsed time between injection and detection is called the retention time.
However, this value should never be interpreted in isolation.
A retention time of 14.2 minutes on one HPLC instrument is not automatically equivalent to 14.2 minutes on another instrument.
That distinction forms the foundation of accurate peptide analysis.
Why Understanding Retention Time in Peptide HPLC Matters
Retention time provides far more information than simply indicating when a peak appears.
When interpreted correctly, it helps researchers evaluate:
• Peptide identity
• Sample consistency
• Batch reproducibility
• Purification performance
• Structural changes
• Chromatographic method suitability
• Potential impurities
• Instrument health
Conversely, misunderstanding retention time often results in:
• Rejecting perfectly acceptable peptide batches
• Misinterpreting Certificates of Analysis
• Assuming degradation where none exists
• Incorrectly comparing data between laboratories
• Wasting weeks troubleshooting the wrong problem
In our experience supporting peptide researchers, many apparent “peptide failures” ultimately trace back to chromatographic conditions—not the peptide itself.
Understanding retention time allows researchers to distinguish between genuine quality concerns and normal analytical variation.
The Fundamental Principle Behind Retention Time
A peptide’s retention time depends primarily on one characteristic:
Its hydrophobic footprint.
Hydrophobic amino acids—including leucine, isoleucine, valine, phenylalanine, and tryptophan—interact strongly with the hydrophobic stationary phase of a C18 column.
The stronger those interactions become, the longer the peptide remains inside the column.
Hydrophilic amino acids such as lysine, arginine, glutamate, and aspartate exhibit weaker interactions and therefore elute much earlier.
This is why peptides with similar molecular weights may display dramatically different retention times.
The chromatographic column is not separating peptides by size.
It is separating them by how strongly they interact with the stationary phase under carefully controlled chemical conditions.
Understanding this simple principle explains nearly every retention time difference observed in peptide RP-HPLC.
Why Retention Time Is Never an Absolute Number
One of the biggest mistakes researchers make is treating retention time like molecular weight.
Molecular weight is an intrinsic property.
Retention time is not.
Instead, retention time reflects the interaction between:
• The peptide
• The chromatographic column
• The mobile phase
• The temperature
• The instrument
• The gradient
• The laboratory environment
Change any one of these variables and retention time may change—even when the peptide itself remains completely unchanged.
This explains why authentic peptides often produce different chromatograms when analyzed by different laboratories using seemingly identical methods.
Understanding this concept prevents countless hours of unnecessary troubleshooting and helps researchers focus on the real source of analytical variation.
Factors That Influence Retention Time in Peptide HPLC
Understanding Retention Time in Peptide HPLC: Why One Peptide Can Produce Different Results
One of the greatest strengths of Reverse-Phase HPLC (RP-HPLC) is its ability to consistently separate peptides with remarkable precision. Yet this precision often leads researchers to believe retention time should remain identical from one analysis to another.
In reality, Understanding Retention Time in Peptide HPLC requires recognizing that retention time is dynamic rather than fixed.
Think of retention time as a conversation between the peptide and the chromatographic system. If either participant changes, the conversation changes—and so does the retention time.
This explains why an authentic peptide can produce different retention times on different instruments while remaining chemically identical.
Below are the major variables experienced chromatographers evaluate before concluding that a peptide itself is responsible for a retention time shift.
Factors That Influence Retention Time in Peptide HPLC
1. Column Chemistry
The HPLC column is the heart of peptide separation.
Although many researchers simply specify “C18,” two C18 columns are rarely identical.
Differences include:
• Carbon loading
• Silica purity
• Surface area
• Particle size
• Pore diameter
• Endcapping chemistry
• Bonding density
Each characteristic changes how strongly peptides interact with the stationary phase.
For example, basic peptides often interact more strongly with exposed silanol groups on non-endcapped columns, producing longer retention times and peak tailing.
Fully endcapped columns minimize these secondary interactions, resulting in sharper and more reproducible chromatograms.
Practical Tip
Never assume that changing from one manufacturer’s C18 column to another will reproduce identical retention times.
2. Mobile Phase Composition
The mobile phase acts as the chemical environment through which peptides travel.
Even tiny variations in solvent composition can significantly alter chromatographic behavior.
Typical peptide RP-HPLC mobile phases include:
Mobile Phase A
• Water
• 0.1% Trifluoroacetic Acid (TFA)
Mobile Phase B
• Acetonitrile
• 0.1% TFA
Changing any component—including solvent quality or acid concentration—can shift retention time.
For example:
• Lower TFA concentration generally decreases retention.
• Higher organic content shortens retention.
• Different ion-pairing agents change peptide selectivity.
This is why freshly prepared mobile phases are essential for reproducible chromatography.
3. Mobile Phase pH
Peptides contain amino acids that gain or lose electrical charge depending on pH.
Those changes directly affect hydrophobic interactions with the stationary phase.
A small pH change can alter:
• Peptide ionization
• Peak shape
• Selectivity
• Retention time
Basic residues such as:
• Lysine
• Arginine
• Histidine
are especially sensitive to mobile phase conditions.
Even slight pH drift caused by poorly prepared solvents can produce noticeable retention time differences.
4. Column Temperature
Temperature is often underestimated during peptide analysis.
In reality, chromatographic retention is highly temperature dependent.
Increasing temperature generally:
• Reduces solvent viscosity
• Improves mass transfer
• Speeds peptide desorption
• Shortens retention time
Even a 1°C difference may shift retention by several tenths of a minute.
For laboratories seeking reproducible results, temperature-controlled column ovens are strongly recommended over relying on ambient room conditions.
5. Gradient Profile
Most peptide analyses use gradient elution rather than isocratic conditions.
Instead of maintaining constant solvent composition, the instrument gradually increases the percentage of organic solvent throughout the run.
The gradient determines exactly when peptides lose affinity for the stationary phase.
Changing:
• Starting organic percentage
• Ending organic percentage
• Gradient slope
• Gradient duration
can dramatically alter retention.
A peptide eluting at 16 minutes using a 30-minute gradient may elute at only 11 minutes using a steeper gradient—even though nothing about the peptide has changed.
6. Flow Rate
Flow rate controls how quickly mobile phase moves through the chromatographic system.
Higher flow rates generally reduce retention time because peptides spend less time interacting with the stationary phase.
However, excessively high flow rates may:
• Reduce resolution
• Increase system pressure
• Compress chromatographic peaks
Experienced analysts optimize flow rate to balance speed and separation efficiency.
7. Instrument Dwell Volume
Among experienced chromatographers, dwell volume is one of the most overlooked causes of inter-laboratory retention time differences.
Dwell volume refers to the volume between the solvent mixer and the head of the chromatographic column.
Why does this matter?
The programmed gradient begins immediately inside the instrument—but it does not reach the column until that dwell volume has been displaced.
Therefore:
Small dwell volume systems deliver gradients earlier.
Large dwell volume systems delay gradient arrival.
The peptide itself never changed.
Only the instrument architecture changed.
This is one of the biggest reasons identical methods produce different retention times across laboratories.
8. Peptide Sequence
Every amino acid contributes differently to chromatographic retention.
Hydrophobic amino acids increase retention.
Polar amino acids reduce retention.
A single amino acid substitution may noticeably shift retention time.
For example:
Replacing:
Leucine → Lysine
can significantly shorten retention because the peptide becomes more hydrophilic.
Conversely,
Replacing:
Aspartic Acid → Phenylalanine
usually increases retention because hydrophobicity increases.
This sensitivity allows RP-HPLC to separate peptides differing by only one amino acid.
9. Oxidation and Chemical Modifications
Minor chemical modifications frequently alter chromatographic behavior.
Common examples include:
• Methionine oxidation
• Deamidation
• Acetylation
• Phosphorylation
• PEGylation
Interestingly, oxidation often causes peptides to elute earlier, not later.
Why?
Adding oxygen increases polarity, reducing interaction with the hydrophobic stationary phase.
Recognizing whether modified peptides elute earlier or later helps analysts identify the underlying chemical change before confirming it with LC-MS.
10. Storage Conditions
Storage can subtly influence chromatographic performance.
Poor storage may cause:
• Oxidation
• Hydrolysis
• Moisture uptake
Aggregation
These changes may produce:
• Additional impurity peaks
• Broader peaks
• Slight retention shifts
Proper storage—including protection from moisture, repeated freeze-thaw cycles, and prolonged exposure to light—helps preserve peptide integrity and chromatographic consistency.
Understanding Retention Time in Peptide HPLC Across Different Peptide Classes
Not all peptides behave alike.
Their amino acid composition largely determines when they elute during an RP-HPLC gradient.
Below is a practical comparison frequently observed in analytical laboratories using standard C18 methods.
| Peptide Class | Typical Retention Window | Chromatographic Behavior |
| Hydrophobic Peptides | 2-8 minute | Weak retention; may elute near the solvent front |
| Standard Therapeutic Peptides | 10-22 minute | Sharp, symmetrical, highly producible peaks |
| Hydrophobic Peptides | 25+ minutes | Strong retention; may exhibit peak broadening or carryover |
| Cyclic or Disulfide-Rich Peptides | Often 1-3 minutes earlier than linear analogues | Compact structure reduces exposed hydrophobic surface |
Why Hydrophobic Peptides Behave Differently
Hydrophobic peptides containing abundant:
• Leucine
• Isoleucine
• Valine
• Phenylalanine
• Tryptophan
bind aggressively to C18 stationary phases.
These peptides often require:
• Higher acetonitrile concentrations
• Longer gradients
• Additional column washing
Without sufficient washing, they may remain partially adsorbed, producing carryover or “ghost peaks” in subsequent injections.
Why Cyclic Peptides Often Elute Earlier
Many researchers expect cyclization to increase retention.
Interestingly, the opposite is often observed.
Cyclization folds portions of the peptide inward.
This buries hydrophobic residues inside the molecular structure, reducing the exposed hydrophobic surface available to interact with the stationary phase.
As a result, cyclic peptides frequently elute 1–3 minutes earlier than their corresponding linear sequences under identical chromatographic conditions.
Understanding this behavior helps researchers correctly interpret chromatograms involving disulfide-rich peptides such as oxytocin and other constrained peptide analogues.
Expert Insight from Peptide Amino Nation
One lesson we’ve learned after reviewing countless Certificates of Analysis is that retention time should never be interpreted in isolation.
A retention time shift does not automatically indicate peptide degradation.
Before questioning peptide quality, experienced analysts first examine:
• Mobile phase preparation
• Column condition
• Temperature stability
• Instrument dwell volume
• Gradient accuracy
• Solvent freshness
Only after eliminating analytical variables should attention shift toward the peptide itself.
This systematic approach has helped researchers avoid unnecessary batch rejection and prevented expensive experimental delays.
As we often remind our customers:
Transparency matters more than simply advertising “98% purity.” Understanding the science behind chromatographic behavior is far more valuable than relying on a single number printed on a Certificate of Analysis
Six Dangerous Misconceptions About Retention Time in Peptide HPLC
Understanding Retention Time in Peptide HPLC goes far beyond knowing when a peptide appears on a chromatogram. Over the years, we’ve spoken with researchers, procurement teams, contract laboratories, and academic institutions that unknowingly made critical decisions based on common misconceptions about retention time and HPLC purity.
Many of these misunderstandings have resulted in rejected peptide batches, delayed projects, unnecessary troubleshooting, and avoidable research expenses.
The good news?
Once you understand what retention time actually represents—and what it doesn’t—you can interpret chromatograms with far greater confidence.
Let’s examine the most common misconceptions and the scientific realities behind them.
Misconception #1: Retention Time Is an Absolute Property of a Peptide
This is, without question, the most common misconception in peptide chromatography.
Many researchers believe that if a peptide elutes at 14.5 minutes on a supplier’s Certificate of Analysis, it should also elute at 14.5 minutes in every laboratory around the world.
Unfortunately, chromatography doesn’t work that way.
The Reality
Retention time depends on the entire chromatographic system, including:
• Instrument configuration
• Dwell volume
• Column chemistry
• Flow rate
• Mobile phase composition
• Temperature
• Gradient profile
Even when two laboratories follow the same written method, small differences in hardware can produce noticeable retention time shifts.
Real-World Example
Imagine two research laboratories analyzing the same authenticated peptide.
Laboratory A
• Modern UHPLC system
• Low dwell volume
• High-efficiency column
Laboratory B
• Conventional HPLC system
• Larger dwell volume
• Different tubing configuration
Both laboratories inject the identical peptide.
Both obtain excellent chromatograms.
Yet the peptide elutes nearly one minute later in Laboratory B.
The peptide has not changed.
The chromatographic environment has.
Expert Tip
Never compare raw retention times between different laboratories without also comparing chromatographic conditions.
Misconception #2: Identical Retention Times Mean Identical Peptides
Many buyers mistakenly assume that if two chromatographic peaks appear at the same retention time, they must represent the same peptide.
This assumption can lead to serious analytical errors.
The Reality
Different molecules can share similar chromatographic behavior.
This phenomenon is known as co-elution.
Closely related compounds frequently overlap, including:
• Truncated peptides
• Deletion sequences
• Diastereomers
• Structural isomers
• Oxidation products
• Synthetic by-products
These compounds may elute at nearly identical retention times despite having very different biological properties.
Why LC-MS Matters
Retention time alone cannot confirm molecular identity.
Mass spectrometry provides the missing piece by confirming molecular weight.
Together, RP-HPLC and LC-MS provide both:
• Chromatographic behavior
• Molecular identity
Neither technique should be interpreted independently.
Misconception #3: A Shifting Retention Time Means the Peptide Is Degrading
Few situations create more unnecessary concern than observing a gradual retention time shift during repeated injections.
Many researchers immediately conclude:
“The peptide must be degrading.”
In most cases, that conclusion is incorrect.
The Reality
Retention time drift is far more commonly caused by instrument or solvent instability.
Common causes include:
• Poor column equilibration
• Temperature fluctuations
• Pump check valve wear
• Flow instability
• Air bubbles
• Mobile phase evaporation
• Aging solvents
Each of these variables changes chromatographic conditions without altering the peptide itself.
Practical Example
One laboratory noticed retention time gradually increasing throughout the day.
Initially, the peptide supplier was blamed.
After investigation, the actual problem proved surprisingly simple.
The column oven thermostat had begun fluctuating by only a few degrees.
Once temperature stability was restored, retention times immediately returned to normal.
The peptide had never changed.
Misconception #4: A 98% Pure Peptide Means 98% of the Powder Is Peptide
This misunderstanding affects countless peptide buyers.
It is also one of the most important concepts every researcher should understand before purchasing peptides.
The Reality
HPLC purity is relative, not absolute.
When a Certificate of Analysis reports:
98% Purity
it means:
98% of the UV-detectable chromatographic peak area belongs to the target peptide.
It does not mean:
• 98% of the vial weight is peptide.
• 98% of the powder consists of active peptide molecules.
Lyophilized peptide powders also contain:
• Residual moisture
• Counterions
• Trifluoroacetate (TFA)
• Acetate
• Hydrochloride salts
These materials are not included in HPLC purity calculations.
Why Net Peptide Content Matters
Many research-grade peptides contain only:
70–85% actual peptide by weight
The remaining percentage often consists of water and counterions.
Researchers calculating molar concentrations should therefore consider Net Peptide Content, not just HPLC purity.
Misconception #5: All 95% Pure Peptides Are Equivalent
Many purchasing decisions stop after reading one number:
95% Purity
Experienced researchers know that number tells only part of the story.
The Reality
The remaining 5% matters enormously.
For example:
Sample A
95% target peptide
5% harmless truncated fragment
Biological impact:
Minimal.
Sample B
95% target peptide
5% antagonist peptide
Biological impact:
Potentially devastating.
The chromatographic purity appears identical.
The biological outcomes may be completely different.
This is why impurity profiling is often more valuable than the purity percentage itself.
Misconception #6: A Certificate of Analysis Guarantees Sterility
Another common misunderstanding involves interpreting Certificates of Analysis.
Many buyers assume that analytical testing automatically confirms sterility.
It does not.
What a Standard COA Usually Confirms
Most Certificates of Analysis verify:
• HPLC purity
• LC-MS identity
• Molecular weight
What They Usually Do NOT Confirm
Unless specifically requested, they generally do not include:
• Sterility testing
• Endotoxin analysis
• Pyrogen testing
• Microbial contamination
• Limulus Amebocyte Lysate (LAL) testing
Researchers performing animal studies should always verify whether endotoxin testing has been completed before beginning in vivo work.
High chemical purity does not guarantee biological safety.
How to Read an HPLC Chromatogram Like an Expert
Many first-time researchers immediately focus on one thing:
The tallest peak.
Experienced chromatographers look elsewhere first.
Here’s the systematic approach we recommend to every customer.
Step 1: Examine the Baseline
Before evaluating peaks, study the baseline.
Ask yourself:
Is it stable?
A stable baseline indicates:
• Proper pump performance
• Good solvent preparation
• Reliable integration
An unstable baseline may suggest:
• Air bubbles
• Detector instability
• Temperature fluctuations
• Poor solvent mixing
Without a stable baseline, quantitative purity values become less reliable.
Step 2: Evaluate Peak Symmetry
Ideally, chromatographic peaks should resemble symmetrical Gaussian curves.
Watch for:
• Peak Tailing
• Possible causes:
• Column degradation
Secondary silanol interactions
Basic peptide adsorption
Column overload
Peak Fronting
Usually indicates:
• Excessive injection mass
• Sample overload
Peak shape often reveals more about system health than retention time itself.
Step 3: Look for Hidden Shoulders
Zoom into the sides of the main peak.
Do you notice a slight bump?
That “shoulder” may represent:
• Deletion sequences
• Closely related impurities
• Incomplete separation
Automated integration software sometimes combines shoulders into one large peak, artificially increasing reported purity.
Experienced analysts never rely exclusively on automated integration.
They inspect chromatograms manually.
Step 4: Check Peak Width
Sharp peaks indicate:
• High column efficiency
• Good separation
• Excellent chromatography
Broad peaks may indicate:
• Aging columns
• Poor mobile phase conditions
• Conformational heterogeneity
• Slow mass transfer
Peak width provides valuable information about overall chromatographic performance.
Step 5: Locate the Solvent Front
Every chromatogram begins with an injection disturbance known as the solvent front or dead volume.
If your peptide elutes almost immediately after this point, ask yourself:
Did the peptide actually retain on the column?
Minimal retention reduces separation and increases the likelihood of hidden impurities.
A proper analytical method should allow sufficient interaction between peptide and stationary phase before elution.
Expert Checklist for Reviewing Any Peptide Chromatogram
Before accepting a peptide batch, review the chromatogram using this checklist.
✅ Stable baseline
✅ Sharp, symmetrical peak
✅ No unresolved shoulders
✅ Good separation from solvent front
✅ Consistent retention time
✅ Appropriate peak width
✅ LC-MS identity confirmation
Following this simple workflow dramatically reduces the chances of overlooking important analytical problems.
Why We Encourage Researchers to Read Beyond the Purity Number
At Peptide Amino Nation, we believe researchers deserve more than a headline purity percentage.
A chromatogram tells a story.
The retention time, peak shape, baseline quality, impurity profile, and analytical conditions together provide a far more accurate picture of peptide quality than a single number printed on a Certificate of Analysis.
That’s why our philosophy remains simple:
Transparency matters more than simply advertising “98% purity.”
Helping researchers understand the science behind peptide analysis leads to better purchasing decisions, stronger experimental reproducibility, and greater confidence in laboratory results.
Real Laboratory Case Studies and the Complete Peptide Quality Control Workflow
One of the greatest advantages of Understanding Retention Time in Peptide HPLC is that it transforms chromatograms from simple analytical reports into powerful troubleshooting tools.
Experienced analytical chemists rarely rely on a single number when evaluating peptide quality.
Instead, they examine:
• Retention time
• Peak symmetry
• Peak width
• Baseline stability
• LC-MS identity
• Chromatographic conditions
Together, these parameters reveal whether a peptide batch truly meets quality specifications.
In this section, we’ll examine two real-world laboratory case studies that demonstrate how retention time prevented costly research mistakes, followed by a behind-the-scenes look at the quality control workflow used before research peptides reach customers.
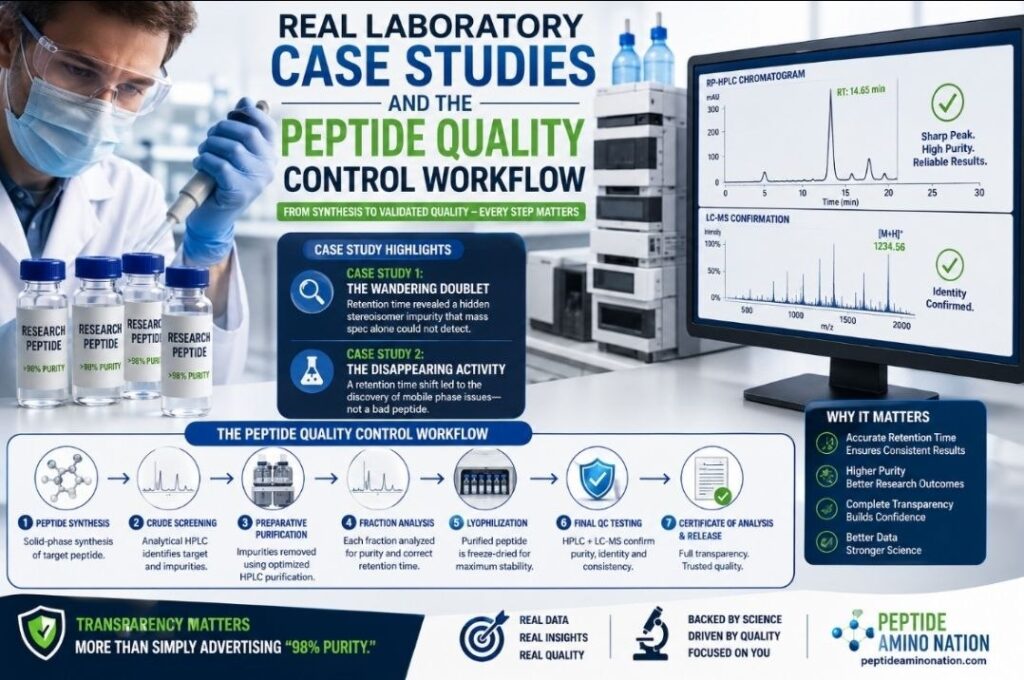
Case Study 1: The Case of the Wandering Doublet
Background
A biotechnology company was scaling up production of a synthetic 24-amino acid hydrophobic peptide intended for preclinical animal research.
For several production batches, analytical RP-HPLC consistently showed a single, sharp peak at:
18.2 minutes
The chromatographic method had remained unchanged for months.
Quality control was highly reproducible.
Then Batch 04 arrived.
The First Warning Sign
Initial analytical HPLC looked almost perfect.
The primary peptide peak appeared at:
18.1 minutes
This was completely acceptable.
However, analysts noticed something unusual.
A second peak appeared at:
19.5 minutes
Although relatively small, it represented approximately 6% of the total chromatographic area.
Many laboratories might have dismissed this as a routine oxidation product.
Fortunately, the analytical team investigated further.
Why Retention Time Changed the Investigation
Oxidation generally increases peptide polarity.
More polar peptides interact less strongly with a C18 column.
Consequently, oxidized peptides usually elute earlier, not later.
But the mysterious impurity behaved differently.
Instead of eluting before the parent peptide, it eluted significantly later.
That observation immediately ruled out oxidation.
Retention time had already revealed valuable structural information before mass spectrometry was even performed.
LC-MS Revealed an Unexpected Surprise
The analytical team performed LC-MS on both peaks.
Results showed:
Main Peak
Expected molecular weight.
Unknown Peak
Exactly the same molecular weight.
At first glance, this appeared impossible.
How could two different chromatographic peaks possess identical molecular masses?
The Diagnosis
Because molecular weight was identical while retention behavior differed, analysts concluded the impurity was a structural isomer.
Further investigation traced the issue back to peptide synthesis.
During coupling of a sterically hindered amino acid residue, partial racemization had occurred.
A small fraction of the natural L-isomer had converted into its D-isomer.
Although molecular weight remained unchanged, the three-dimensional structure—and therefore the peptide’s hydrophobic surface—had changed.
The D-isomer interacted more strongly with the C18 stationary phase, producing the later retention time.
Why This Discovery Saved the Project
If analysts had relied only on direct-infusion mass spectrometry, the batch would have passed quality control.
The molecular weight was correct.
Retention time revealed what mass spectrometry alone could not.
The purification gradient was adjusted to separate the unwanted stereoisomer.
The compromised fraction was removed.
The client received a structurally correct peptide suitable for biological evaluation.
Without RP-HPLC, the impurity could easily have produced inconsistent animal study results and months of misleading biological data.
Lessons from Case Study 1
This investigation reinforces one important principle:
Mass spectrometry tells you what a peptide weighs. Retention time tells you how that peptide behaves.
Both techniques are indispensable.
Neither should be interpreted independently.
Case Study 2: The Mystery of the Disappearing Biological Activity
Sometimes the peptide isn’t the problem.
The analytical system is.
One university research laboratory learned this lesson the hard way.
The Problem
The laboratory had purchased a 14-amino acid phosphorylation-targeting peptide from a reputable supplier.
The supplied Certificate of Analysis showed:
• Greater than 98% HPLC purity
• Perfect LC-MS identity
• A sharp chromatographic peak at 14.2 minutes
Everything appeared correct.
Yet the peptide completely failed during cell-signaling experiments.
No biological activity could be detected.
The research team initially suspected:
• Shipping damage
• Incorrect synthesis
• Peptide degradation
Technical support was contacted immediately.
The Investigation
Rather than assuming the peptide was defective, we asked the laboratory to repeat the analytical HPLC method exactly as described on the Certificate of Analysis.
The results were revealing.
Instead of eluting at 14.2 minutes, the peptide appeared at:
11.8 minutes
The peak remained sharp and symmetrical.
There were no degradation peaks.
No shoulders.
No evidence of hydrolysis.
Only one significant difference:
The peptide eluted much earlier.
Eliminating the Obvious Causes
The laboratory confirmed:
• Correct column
• Correct flow rate
• Correct gradient
• Proper instrument calibration
Nothing appeared abnormal.
Attention shifted toward solvent preparation.
The Real Culprit
During discussions with laboratory staff, one important detail emerged.
Their Mobile Phase A had been prepared nearly one month earlier and stored in a loosely capped container.
Because Trifluoroacetic Acid (TFA) is highly volatile, much of the ion-pairing agent had gradually evaporated.
As TFA concentration decreased:
• Basic amino acid residues became more highly charged.
• Peptide hydrophobicity decreased.
• Interaction with the C18 column weakened.
• Retention time shifted dramatically earlier.
The peptide itself had never changed.
Only the chromatography had.
The Solution
Fresh mobile phases were prepared using newly opened TFA.
The HPLC system was flushed.
The sample was reinjected.
This time, the peptide eluted at:
14.1 minutes
Almost identical to the supplier’s Certificate of Analysis.
When the laboratory repeated its biological assay using freshly prepared solutions, the expected signaling response immediately returned.
The experiment was successfully rescued.
Lessons from Case Study 2
Retention time doesn’t only evaluate peptides.
It also evaluates the health of your analytical system.
Unexpected retention shifts frequently indicate problems with:
• Mobile phases
• Instrument maintenance
• Temperature stability
• Column performance
• Solvent preparation
Experienced chromatographers investigate the system before blaming the peptide.
Inside Our Peptide Quality Control Workflow
At Peptide Amino Nation, quality assurance begins long before a Certificate of Analysis is generated.
Every peptide undergoes a structured analytical workflow designed to verify identity, purity, and chromatographic consistency before release.
Our philosophy remains simple:
Transparency matters more than simply advertising “98% purity.”
Below is the workflow we believe every reputable peptide supplier should follow.
Step 1: Crude Peptide Screening
Immediately after Solid-Phase Peptide Synthesis (SPPS), the crude peptide contains:
• Target peptide
• Truncation sequences
• Deletion products
• Side products
• Residual synthesis reagents
A small sample is injected onto an analytical RP-HPLC system.
The goal is not to determine final purity.
Instead, analysts identify where the target peptide elutes relative to impurities.
This information guides purification strategy.
Step 2: Preparative HPLC Purification
The crude peptide is transferred to a preparative HPLC system equipped with large-scale purification columns.
Optimized solvent gradients separate:
• Desired peptide
• Closely related impurities
• Truncated sequences
• Reaction by-products
As peaks elute, automated fraction collectors capture individual fractions for further evaluation.
Step 3: Fraction Analysis
Every collected fraction is analyzed individually using analytical RP-HPLC.
Quality control personnel examine:
• Retention time
• Peak symmetry
• Baseline quality
• Peak purity
Only fractions meeting predetermined purity specifications are pooled together.
Fractions containing impurities are either discarded or subjected to additional purification.
Step 4: Lyophilization
Purified peptide solutions undergo freeze-drying.
During lyophilization:
• Water is removed.
• Organic solvents are eliminated.
• Stable peptide powder is produced.
The result is a dry material suitable for long-term storage.
Step 5: Final Analytical Verification
Once lyophilization is complete, the peptide undergoes independent quality verification.
This stage generates the analytical data included in the Certificate of Analysis.
Testing includes:
Final RP-HPLC
Used to determine:
• Retention time
• Peak purity
• Chromatographic profile
LC-MS
Used to confirm:
• Molecular weight
• Sequence identity
• Target peptide confirmation
Only batches satisfying analytical specifications proceed to packaging.
Step 6: Documentation and Batch Release
Before shipment, quality control personnel review:
• Chromatograms
• Mass spectra
• Analytical calculations
• Batch documentation
• Instrument records
Only after passing every quality checkpoint is the Certificate of Analysis approved.
The peptide is then packaged, sealed, and prepared for shipment.
Why HPLC and LC-MS Must Always Work Together
A recurring theme throughout this guide is that neither HPLC nor mass spectrometry tells the complete story independently.
The table below summarizes their complementary strengths.
| Analytical Technique | Primary Purpose | Limitations |
| RP-HPLC | Evaluate purity, separation, retention, behavior, impurity profile | Cannot definitively confirm molecular identity |
| LC-MS | Confirms molecular weight and peptide identity | Cannot reliably distinguish co-eluting structural isomers or evaluate chromatographic purity |
When combined, these techniques provide the highest level of confidence in peptide quality.
This is why reputable peptide suppliers routinely include both analyses when preparing Certificates of Analysis.
Expert Advice for Researchers Purchasing Peptides
Before purchasing research peptides, don’t focus exclusively on the purity percentage.
Instead, ask suppliers for:
• Complete HPLC chromatograms
• LC-MS spectra
• Chromatographic conditions
• Peak integration reports
• Counterion information
• Net peptide content
• Endotoxin testing (for in vivo research)
These documents provide far greater confidence than a single purity number ever could.
At Peptide Amino Nation, we encourage researchers to understand their analytical data rather than simply accept marketing claims.
Better data leads to better science.
Better science leads to more reproducible research.
How Retention Time Helps You Buy Better Peptides + FAQs & Final Takeaways
Understanding Retention Time in Peptide HPLC Helps You Become a Smarter Peptide Buyer
Understanding Retention Time in Peptide HPLC is not only valuable for analytical chemists—it is equally important for researchers, biotechnology companies, pharmaceutical developers, universities, and procurement teams purchasing research peptides.
Many buyers focus almost exclusively on one number:
98% Purity
While purity is certainly important, experienced peptide scientists know that it tells only part of the story.
The chromatogram, retention time, LC-MS data, analytical method, and Certificate of Analysis together provide the complete picture of peptide quality.
Understanding these details allows researchers to avoid poor-quality batches, reduce failed experiments, and maximize research budgets.
How Retention Time Protects Your Research Budget
1. It Helps Detect Hidden Impurities
A chromatogram may report:
98% Purity
However, careful examination may reveal a small shoulder attached to the main peak.
That shoulder often represents:
• Deletion sequences
• Truncated peptides
• Closely related impurities
• Poor chromatographic separation
Experienced researchers always inspect the chromatogram rather than relying solely on the reported purity percentage.
One overlooked impurity can invalidate weeks of experimental work.
2. It Helps Identify Structural Isomers
Mass spectrometry confirms molecular weight.
It cannot reliably distinguish:
• D-amino acid substitutions
• Diastereomers
• Certain structural isomers
Retention time frequently reveals these hidden differences.
Multiple peaks with identical molecular masses often indicate structural variation rather than incorrect synthesis.
Different C18 Columns
Not all C18 columns are manufactured equally.
Variables include:
• Silica purity
• Carbon loading
• Endcapping
• Particle size
• Pore diameter
• Surface chemistry
These differences influence peptide interaction with the stationary phase.
Changing column brands alone may alter retention time.
Tubing Configuration
Extra-column volume often receives little attention.
Longer tubing between:
• Injector and column
• Column and detector
creates additional delay, shifting chromatographic peaks.
Mobile Phase Aging
Trifluoroacetic Acid (TFA) gradually evaporates if solvents are poorly sealed.
As TFA concentration changes:
• Ion pairing decreases.
• Peptide charge increases.
• Retention time shortens.
Fresh mobile phases remain essential for reproducible chromatography.
Temperature Differences
Even a one-degree difference may alter peptide retention.
Laboratories using controlled column ovens generally obtain better reproducibility than laboratories relying on ambient room temperature.
Counterion Differences
Two peptide samples may possess identical amino acid sequences while carrying different counterions, including:
• TFA salts
• Acetate salts
• Hydrochloride salts
Although these differences usually have minimal impact, they can occasionally influence chromatographic focusing and peak shape during injection.
The Golden Rule of Comparing Retention Times
Never compare raw retention times between different laboratories.
Instead, compare:
• Analytical methods
• Mobile phase composition
• Column chemistry
• Flow rate
• Temperature
• Dwell volume
• Internal reference standards
Many experienced laboratories use Relative Retention Time (RRT) instead of absolute retention time because it minimizes system-to-system variation.
What Researchers Should Request from Every Peptide Supplier
Before purchasing research peptides, ask suppliers for more than just a purity percentage.
A trustworthy supplier should willingly provide:
Complete HPLC Chromatogram
Allows evaluation of:
• Peak purity
• Shoulders
• Baseline quality
• Retention behavior
LC-MS Spectrum
Confirms:
• Molecular identity
• Expected molecular weight
Net Peptide Content
Determines:
• Actual peptide mass
• Accurate dosing calculations
Remember:
HPLC purity is not the same as peptide content.
Counterion Information
Researchers performing:
• Cell culture studies
• Animal studies
should know whether the peptide is supplied as:
• TFA salt
• Acetate salt
• Hydrochloride salt
Counterions may influence downstream applications.
Endotoxin Testing
For in vivo experiments, endotoxin testing is essential.
Even chemically pure peptides may produce inflammatory responses if bacterial endotoxins remain present.
Request LAL (Limulus Amebocyte Lysate) testing whenever applicable.
Procurement Checklist Before Purchasing Research Peptides
Use this checklist before approving any peptide purchase.
| Requirement | Why It Matters | Recommendation |
| Full RP-HPLC chromatogram | Reveals impurity and peak quality | Essential |
| LC-MS Data | Confirms peptide identity | Essential |
| Net Peptide Content | Enable accurate dosing | Highly Recommended |
| Counterion Information | Important for biological studies | Highly Recommended |
| Storage Recommendation | Maintains peptide stability | Recommended |
| Endotoxin Information | Critical for animal research | Required for in vivo work |
Why Transparency Matters More Than Marketing
At Peptide Amino Nation, we believe researchers deserve complete analytical transparency—not just attractive purity numbers.
A peptide advertised as 98% pure tells only one part of the story.
Researchers should also understand:
• How purity was measured
• Which analytical methods were used
• What impurities remain
• How retention time behaved
• Whether LC-MS confirmed identity
• What counterion is present
• Whether endotoxins were evaluated
That level of transparency builds confidence, reproducibility, and long-term scientific success.
Our philosophy has always been simple:
We believe transparency matters more than simply advertising “98% purity.”
Whether you’re purchasing catalog peptides or custom peptide synthesis, our goal is to help researchers make informed decisions backed by reliable analytical data.
To learn more about peptide quality standards, peptide handling, Certificates of Analysis, and research-grade peptides, visit Peptide Amino Nation at peptideaminonation.com, where we regularly publish educational resources designed to help scientists, laboratories, and research institutions achieve reproducible results.
Final Thoughts
If there is one lesson every researcher should remember from this guide, it is this:
Retention time is not an inherent property of a peptide—it is a reflection of the entire chromatographic environment.
Every retention time represents the combined influence of:
• Peptide structure
• Column chemistry
• Mobile phase composition
• pH
• Temperature
• Instrument design
• Gradient profile
• Solvent quality
Understanding these variables transforms chromatograms from confusing graphs into valuable scientific tools.
When retention time changes, don’t immediately blame the peptide.
Investigate the analytical system first.
Very often, the answer lies not in the peptide itself but in the chromatography surrounding it.
Finally, remember this guiding principle:
Mass spectrometry tells you what your peptide weighs. Retention time tells you how your peptide behaves.
Master both, and you’ll dramatically improve your ability to evaluate peptide quality, interpret Certificates of Analysis, troubleshoot laboratory issues, and purchase research peptides with confidence.
Check Related Topics Below To Boost Your Knowledge
Can Different Peptides Be Reconstituted the Same Way? 9 Powerful Facts Every Researcher Must Know
Light Exposure vs Peptide Stability: 9 Powerful Truths to Prevent Costly Research Failures
Peptide Purity Above 99% isn’t always the best choice for peptide research
Avoiding Measurement Errors During Peptide Reconstitution
Frequently Asked Questions (FAQ)
What is retention time in peptide HPLC?
Retention time is the time required for a peptide to travel through an HPLC column and reach the detector. In Reverse-Phase HPLC, it primarily reflects how strongly a peptide interacts with the hydrophobic stationary phase under specific chromatographic conditions.
Why does the same peptide have different retention times in different laboratories?
Retention time varies because of differences in instrument dwell volume, column chemistry, mobile phase composition, gradient profile, temperature, flow rate, tubing configuration, and solvent preparation. Identical peptides can legitimately produce different retention times on different systems.
Does a shift in retention time always mean peptide degradation?
No. Most retention time shifts are caused by changes in the chromatographic system rather than degradation. Common causes include mobile phase aging, TFA evaporation, temperature fluctuations, insufficient column equilibration, or instrument maintenance issues.
Can retention time alone confirm peptide identity?
No. Retention time provides valuable information about chromatographic behavior but cannot conclusively identify a peptide. Identity should always be confirmed using LC-MS alongside HPLC analysis.
