How to Read a Peptide COA: 10 Critical Things to Know About HPLC and Mass Spectrometry Reports

Table of Contents
1. What Is a Certificate of Analysis (CoA)?
2. Why CoAs Matter
3. Understanding HPLC Reports
4. Understanding Mass Spectrometry Reports
5. HPLC vs. Mass Spectrometry
6. How to Read Peak-Area Reports
7. Common Red Flags in CoAs
8. Real-World Case Study
9. Expert Tips for Evaluating Peptide Quality
10. Frequently Asked Questions
How to Read a Peptide COA: 10 Critical Things to Know About HPLC and Mass Spectrometry Reports:
What Is a Certificate of Analysis (CoA)?
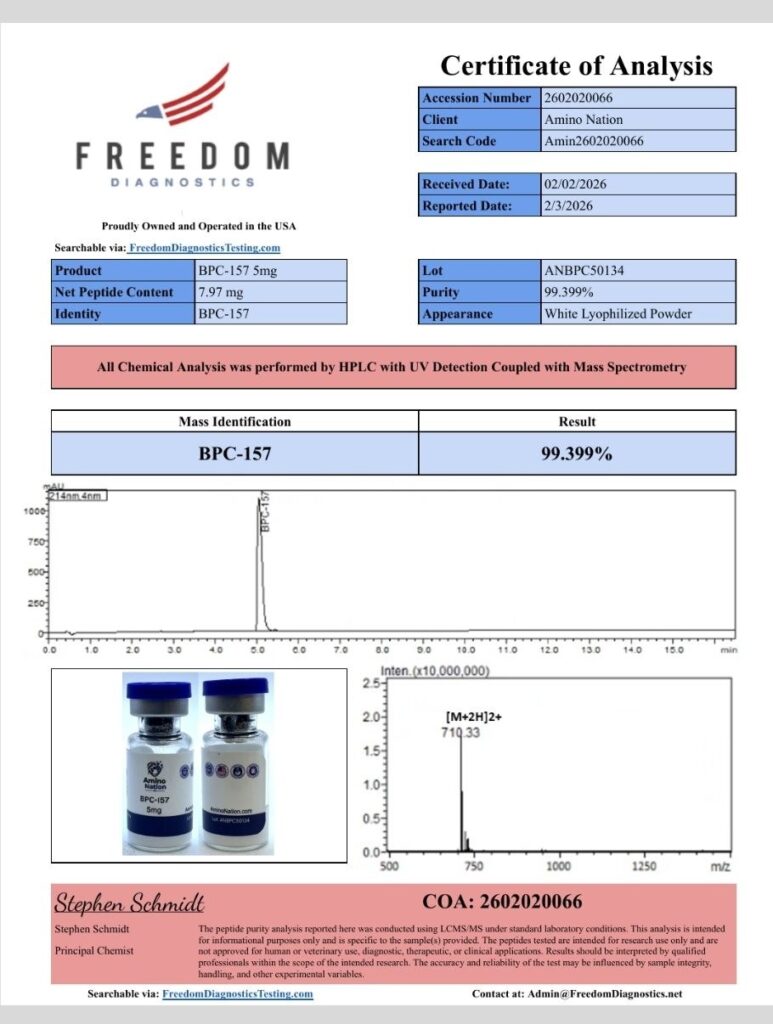
A Certificate of Analysis (CoA) is a laboratory document that provides analytical testing results for a specific batch of material.
For peptides, a CoA is designed to verify:
• Product identity
• Purity
• Batch information
• Analytical testing methods
• Quality control results
Many buyers glance at a purity percentage and assume everything is acceptable. However, professional researchers know that a CoA contains far more information than a single number.
Learning how to read a peptide CoA allows researchers to make informed decisions and better understand laboratory testing data.
Why CoAs Matter
A CoA serves as a transparency tool.
Rather than relying on marketing statements, researchers can evaluate analytical data directly.
A properly documented CoA helps answer critical questions:
• Is this the correct peptide?
• How pure is the sample?
•What impurities are present?
•Was the material tested appropriately?
Understanding these details is an essential skill for anyone working with research peptides.
Understanding HPLC Reports
What Is HPLC?
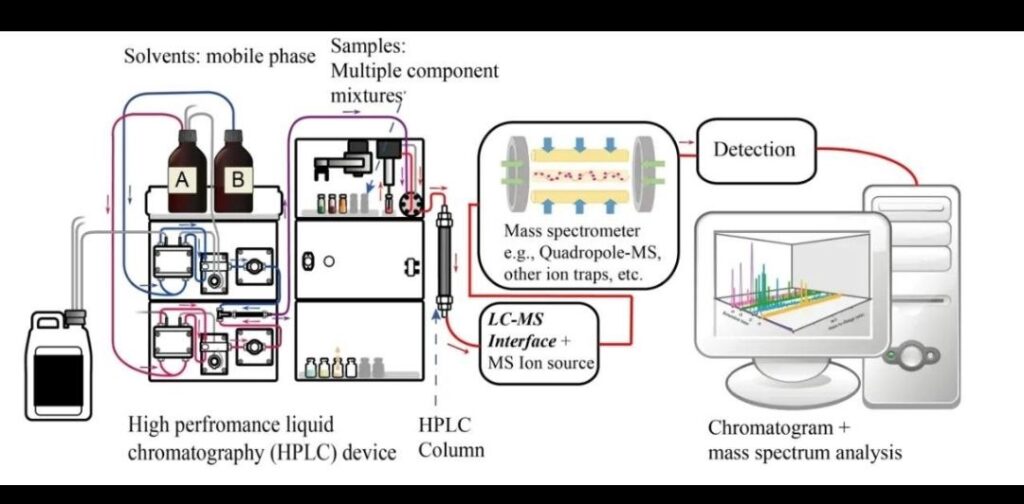
High-Performance Liquid Chromatography (HPLC) is an analytical technique used to measure purity.
The system separates components within a sample based on their chemical interactions with a stationary phase and a mobile phase.
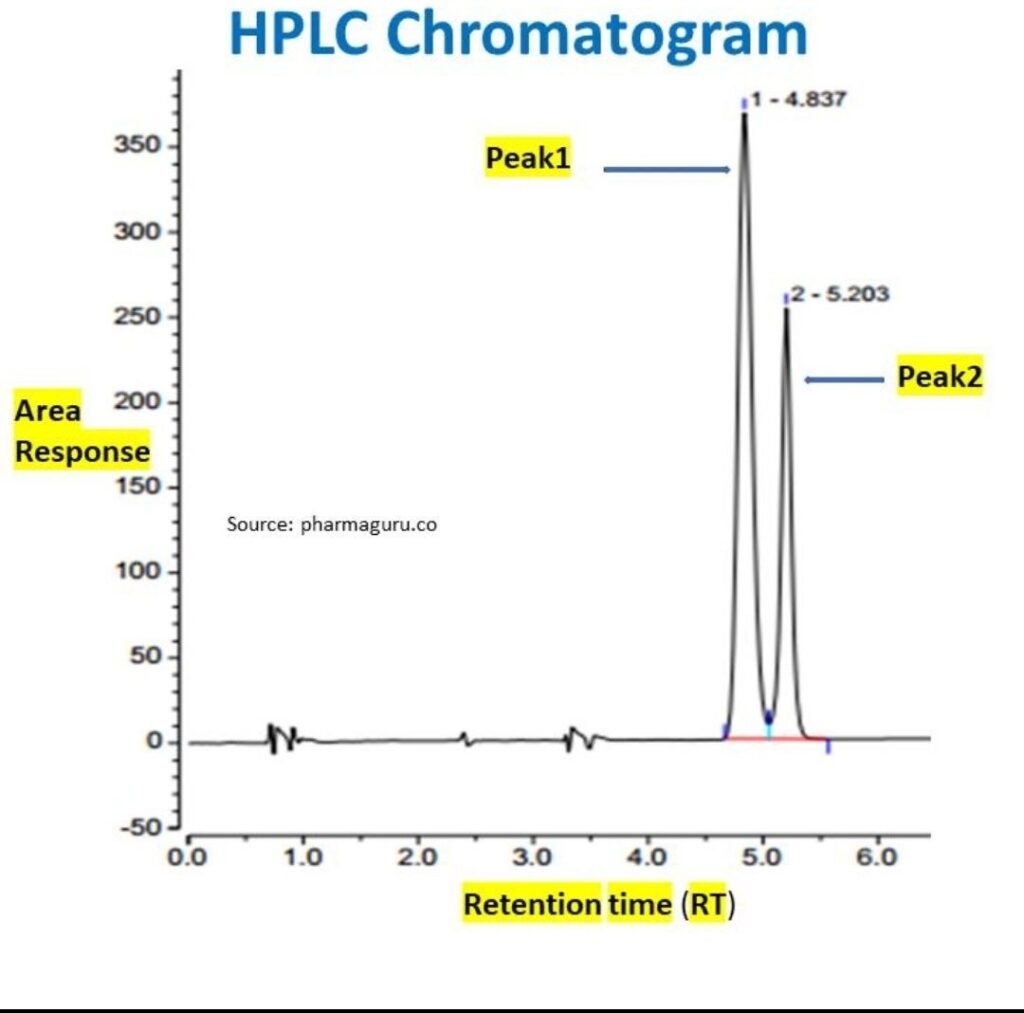
Each compound appears as a peak on a chromatogram.
The resulting graph provides insight into sample composition.
What Does HPLC Measure?
HPLC primarily evaluates purity.
It answers the question:
“How much of the sample consists of the target compound versus other components?”
A high-purity sample generally produces one dominant peak and minimal secondary peaks.
Reading an HPLC Chromatogram
When examining an HPLC report, focus on:
Retention Time
Retention time refers to the time required for a compound to travel through the chromatographic system.
Consistent retention times often indicate consistent compound identity.
Peak Area
Peak area represents the relative quantity of each detected component.
The larger the peak area, the larger the proportion of that compound in the sample.
Purity Percentage
Purity is commonly calculated using peak-area normalization.
For example:
• Main Peak: 98.6%
• Impurity Peak A: 0.8%
• Impurity Peak B: 0.4%
• Impurity Peak C: 0.2%
Total = 100%
In this example, reported purity would be approximately 98.6%.
Understanding Mass Spectrometry Reports
What Is Mass Spectrometry?
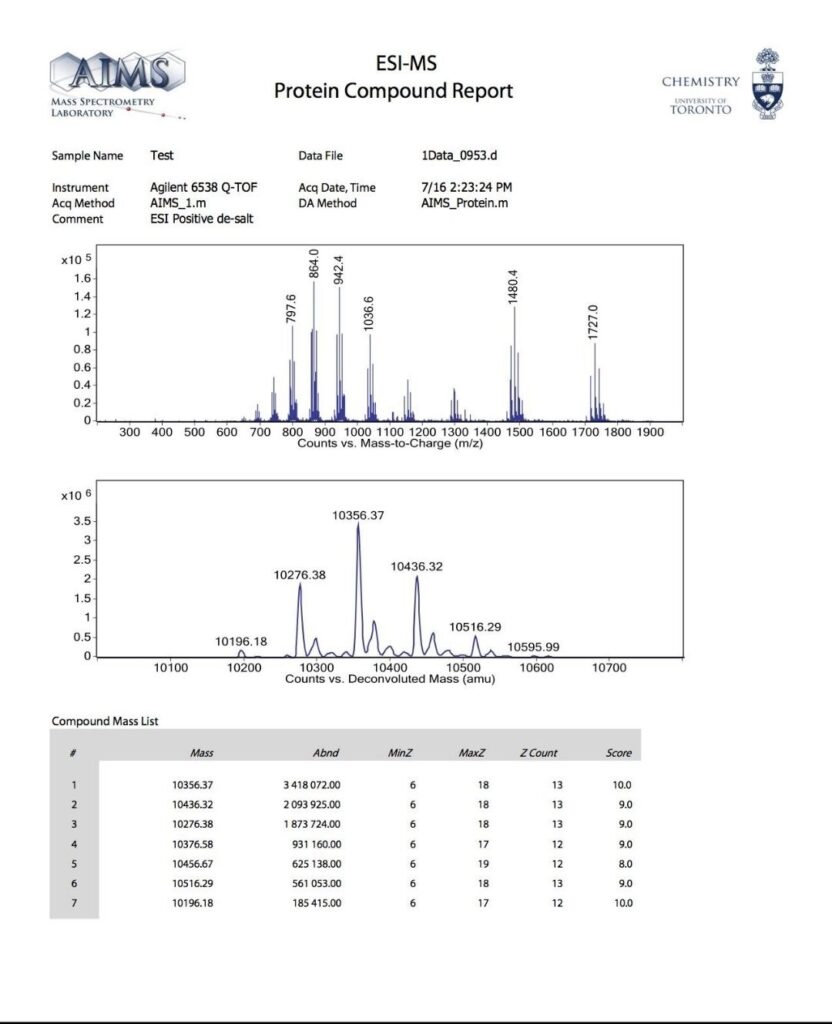
Mass Spectrometry (MS) is used to verify molecular identity.
Unlike HPLC, which focuses on purity, MS focuses on molecular weight.
Mass spectrometry helps answer:
“Is this actually the compound it claims to be?”
How Mass Spectrometry Works
The instrument ionizes molecules and measures their mass-to-charge ratio (m/z).
The resulting spectrum contains peaks representing molecular fragments and molecular ions.
Researchers compare observed values against theoretical values.
What to Look for in an MS Report
Molecular Ion Peak
The primary molecular ion peak should closely match the expected molecular weight.
Isotope Pattern
Larger molecules often display predictable isotope distributions.
Signal Quality
Clear, dominant signals generally provide greater confidence in identity confirmation.
Mass spectrometry verifies identity, not purity.
This distinction is crucial.
HPLC vs Mass Spectrometry
————————————————
| HPLC Analysis | Mass Spectrometry |
| measures purity | |confirm identity |
| separates component | measures molecular weight |
| report peak areas | reports m/z values |
| detect impurities | verify molecular structure |
| answers ‘how pure?” | answers “is it correct?” |
————————————————
Researchers often make the mistake of treating these tests as interchangeable.
They are complementary, not identical.
A complete quality assessment ideally includes both.
How to Read Peak-Area Reports
Peak-area reports are among the most misunderstood sections of a CoA.
Consider the following example:
Peak Area %
Main Peak 98.5
Peak 2 0.7
Peak 3 0.5
Peak 4 0.3
Many readers only focus on the 98.5%.
Professionals also examine:
• Number of impurity peaks
• Relative size of impurities
• Distribution of impurities
• Baseline quality
• Signal consistency
A sample with one dominant peak and minimal secondary peaks generally indicates good chromatographic purity.
Common Red Flags in CoA
Missing Batch Numbers
Every legitimate CoA should reference a specific batch or lot number.
Unclear Laboratory Information
Reports should clearly identify the testing laboratory.
Low-Resolution Chromatograms
Poor-quality graphs can make interpretation difficult.
Missing Analytical Conditions
Testing methods should be documented.
Identity Data Without Purity Data
Mass spectrometry alone does not establish purity.
Purity Data Without Identity Confirmation
HPLC alone cannot confirm molecular identity.
Case Study: Why Purity Alone Can Be Misleading
Imagine two samples.
Sample A:
– HPLC Purity: 99%
– No Mass Spectrometry Data
Sample B:
– HPLC Purity: 98%
– Verified Mass Spectrometry Identity
Many buyers would immediately choose Sample A.
However, Sample B provides stronger overall analytical confidence because both purity and identity have been verified.
This example demonstrates why understanding CoAs requires more than reading a single purity percentage.
Expert Tips for Evaluating Peptide Quality
1. Always review both HPLC and MS reports.
2. Verify lot or batch numbers.
3. Examine peak-area distributions.
4. Compare observed molecular weights to expected values.
5. Look for clear analytical documentation.
6. Review chromatogram quality.
7. Avoid judging quality solely by purity percentage.
8. Understand the difference between purity and identity.
Frequently Asked Questions
1. What is the most important part of a peptide CoA?
The combination of HPLC purity data and mass spectrometry identity verification provides the strongest overall assessment.
2. Does 99% purity guarantee quality?
Not necessarily. Purity does not confirm identity. Both purity and identity testing should be evaluated together.
3. What does peak area mean?
Peak area estimates the relative amount of each detected component within the sample.
4. Can HPLC identify a peptide?
HPLC primarily measures purity. Identity confirmation typically requires mass spectrometry.
5. Why are there multiple peaks on an HPLC report?
Additional peaks often represent impurities, byproducts, or related compounds.
6. What is an acceptable purity level?
Acceptable purity depends on the intended research application and quality standards being followed.
7. What does m/z mean in mass spectrometry?
m/z represents the mass-to-charge ratio measured by the instrument.
8. Should every CoA include a batch number?
Yes. Batch identification is a fundamental component of quality documentation.
9. Can a peptide have high purity but incorrect identity?
Yes. A highly pure sample may still not be the intended compound if identity has not been confirmed.
10. Why do professional researchers review both HPLC and MS reports?
Because purity and identity answer different questions. Together they provide a more complete picture of material quality.
Conclusion
Understanding how to read a peptide CoA is one of the most valuable skills a researcher can develop. HPLC and Mass Spectrometry serve different but complementary purposes. HPLC measures purity, while Mass Spectrometry confirms identity.
By learning to interpret chromatograms, peak-area reports, molecular ion peaks, and analytical documentation, researchers can make more informed decisions and evaluate laboratory data with greater confidence.
For more educational resources on peptide quality control, analytical testing, storage science, and research best practices, visit peptideaminonation.com.

Popular Comments
10 Powerful Signs Of A Reliable Peptide Research Report
[…] Why Reliable Peptide Research Reports Matterhttps://peptideaminonation.com/how-to-read-a-peptide-coa-10-critical-things-to-learn/ […]
Peptide Analytical Vs Preparative HPLC: 9 Powerful Differences Every Researcher Must Understand
[…] What Is Analytical HPLC?https://peptideaminonation.com/how-to-read-a-peptide-coa-10-critical-things-to-learn/ […]
Why Impurities Form During Peptide Synthesis: 7 Critical Mistakes Every Researcher Must Avoid
[…] https://peptideaminonation.com/how-to-read-a-peptide-coa-10-critical-things-to-learn/ […]